
How much plastic is recycled? There is no single percentage that applies everywhere. The UK provisionally recycled 57.3% of plastic packaging in 2025; the US EPA's latest published national plastics-in-municipal-waste series reports 8.7% in 2018. For a consistent worldwide waste benchmark, the OECD estimates 9.5% in 2020. These figures cover different materials, years and accounting systems, so they are not a country league table.
Updated and sources checked: 7 November 2026. “Latest available” means the newest relevant release verified for each series, not that every figure describes 2026. Provisional statistics and modelled estimates are identified below.
Plastic recycling rates at a glance
| Area and measure | Rate | Data year | Source and scope |
|---|---|---|---|
| World: plastic waste actually recycled | 9.5% | 2020 | OECD 2024 model baseline; broad plastics waste |
| UK: plastic packaging | 57.3% (provisional) | 2025 | Defra, September 2026 release; packaging only |
| US: plastics in municipal solid waste | 8.7% | 2018 | US EPA; latest year in this federal series |
| US: PET bottles | 30.2% | 2024 | NAPCOR; bottle collection-based measure, not all plastics |
| European Union: plastic packaging | 42.4% | 2024 | Eurostat, October 2026 release; packaging only |
| Australia: end-of-life plastics | 14% | 2024–25 | DCCEEW, September 2026 release; excludes energy recovery |
Read across each row before comparing rates. Packaging excludes long-lived plastic products such as construction materials. A PET bottle collection rate measures a narrower stream than all plastic waste. None of these percentages means that the same share of every plastic product is turned into another identical product.
How much plastic is recycled globally?
The OECD's 2024 report estimates that, in 2020, the world generated 360 million tonnes of plastic waste. About 57 million tonnes were collected for recycling, but only 34 million tonnes were actually recycled. The report gives the resulting recycling rate as 9.5%, using unrounded modelling data. Collection losses explain why a recycling-bin or sorting-facility figure can exceed useful recycled output.
That global framework covers OECD and non-OECD economies, including Asia, Africa, Latin America, the Middle East and Oceania. It provides a worldwide reference rather than extrapolating from UK or US households. Its 2020 baseline is not a measured 2026 rate. Source: OECD, Policy Scenarios for Eliminating Plastic Pollution by 2040.
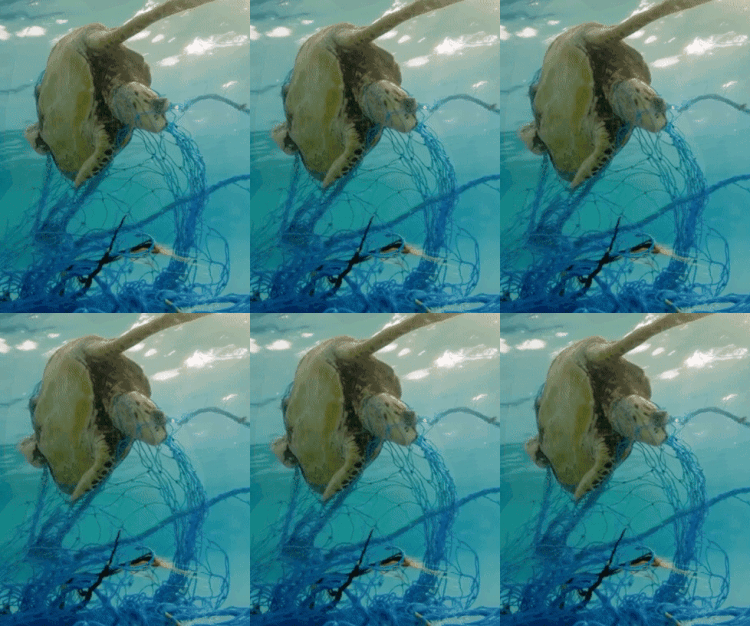
Plastic that escapes collection can harm wildlife through entanglement and ingestion. Our earlier coverage of plastic waste in the oceans provides background; it should not be read as a current global recycling dataset.
What do newer global studies tell us?
A 2025 peer-reviewed trade-linked study using 2022 data estimated around 400 million tonnes of plastic production, including roughly 38 million tonnes of secondary plastic. That is about 9.5% of production. A share of production made from recycled material is not the same denominator as the share of waste recycled. The paper also reports waste flows and acknowledges gaps in informal recycling data; its headline percentage should not simply replace an OECD waste-recycling rate.
A later global assessment, Pew's Breaking the Plastic Wave 2025, models a 2025 baseline and future scenarios. It estimates primary plastic production at 450 million tonnes in 2025. This is a modelled baseline, not a completed worldwide administrative count. Its sector coverage, treatment stages and collection measures must be checked before comparing percentages with OECD or national releases.
How much plastic is recycled in the UK?
Defra's release, updated on 23 September 2026, reports a provisional 57.3% plastic-packaging recycling rate for 2025: approximately 1.207 million tonnes recycled against 2.108 million tonnes of packaging waste arising. Its revised 2024 rate is 53.5%.
These are UK packaging figures, not a rate for every plastic product or only the contents of household recycling bins. The release uses packaging recycling records and reported packaging placed on the market. Its updated producer-data basis also means older published series need care when interpreting trends. Late submissions can revise the provisional result. Source: Defra, Tables 4 and 5 and accompanying methodology.
Putting a bottle in a recycling bin starts a process; it does not establish the final destination of the material. Sorting rejects, contamination, processing losses and the demand for recovered polymer all matter. For practical bottle preparation, see our PET bottle recycling guide.
How much plastic is recycled in the US?
The EPA's material-specific table still ends in 2018. For plastics in municipal solid waste, it records 35.68 million US short tons generated, 3.09 million recycled, 5.62 million combusted with energy recovery and 26.97 million landfilled. Its reported recycling rate is 8.7%.
These are short tons, not metric tonnes, and describe municipal waste rather than every industrial plastic stream. The previous unsupported claim about recycling a quarter of US production has been removed. Source: EPA's plastics table.
PET bottles have a newer, separate dataset
NAPCOR's latest report available at this check covers 2024. It gives a US PET bottle recycling rate of 30.2%, down from a revised 32.5% in 2023. Its infographic describes this as a bottle collection rate. It is not a yield-adjusted rate for all plastics, and cannot be substituted for the EPA figure. Source: NAPCOR's 2024 PET Recycling Report release.
Beyond the UK and US: Europe, Oceania and the wider world
European Union: packaging recycling
Eurostat's 22 October 2026 release puts EU plastic-packaging recycling at 42.4% in 2024, compared with 41.6% in 2023. Per person, the EU generated 35.9 kg of plastic packaging waste and recycled 15.3 kg. The statistics cover packaging across the economy, not all plastics. Differences in national reporting and calculation rules limit direct comparisons with the UK. Source: Eurostat.
Australia: material recycling versus recovery
Australia's newest plastics flows report covers 2024–25. It estimates 3.2 million tonnes reaching end of life, with 442,000 tonnes recycled and 69,000 tonnes used for energy recovery. Its recycling rate is 14%; the broader recovery rate is 16.1%. Burning plastic for energy explains the difference. The report's scope includes plastics in rubber, tyres and synthetic textiles, so it is broader than packaging-only tables. Source: DCCEEW.
Asia, Africa and Latin America: avoid a single regional stereotype
National collection systems, industrial demand and informal waste recovery differ considerably. A national bottle scheme, a continent-wide model and a city collection survey are not interchangeable evidence. Missing data should be labelled as a gap rather than filled with an assumed world average.
Pew's global 2025 model estimates that nearly 12 million informal waste pickers collect and sort plastics. It attributes 61% of plastic packaging received by recycling facilities to that informal sector, including virtually all such material in middle- and low-income economies. That is a share of material sent to recycling, not a claim that 61% of all plastic packaging waste is recycled. Source: Pew's global assessment.
What happens to plastic that is not recycled?
Possible destinations include controlled landfill, incineration, open burning, uncontrolled dumps and leakage into the environment. They should not be combined into a claim that everything unrecycled enters the sea. Material in a landfill has a different management history from litter escaping into a river.
Energy-from-waste incineration can recover energy, but does not return the polymer to use as plastic. Likewise, converting plastic into fuel that is then burned is different from producing feedstock for new plastic. Always check whether “recovery” includes these routes before treating it as recycling.
Why is more plastic not recycled?
- Collection gaps: material cannot enter a recycling plant if there is no accessible collection or return system.
- Mixed materials: different polymers, multilayer structures, pigments and components can complicate sorting and reprocessing.
- Contamination: food, liquid and unsuitable items can reduce usable output.
- Market demand: a technically recyclable material still needs a viable buyer and suitable processing capacity.
- Product requirements: recovered polymer must meet the quality and safety requirements of its next use.
There is no universal requirement to add virgin plastic at every recycling cycle, and no reliable single energy-saving percentage for every polymer and process. Claims about oil saved, landfill volume or the number of times a bottle can be recycled need their own boundaries and evidence.
Waste exports: historical context and current interpretation

China's restrictions changed international waste markets, but statements written during the disruption should not be presented as a description of every destination today. This 2019 Guardian investigation and earlier GQ investigation are retained as historical reporting, not as sources for this article's current recycling rates.
Exports are not automatically evidence of either successful recycling or dumping. Assessment needs the receiving facility, contamination levels, processing losses and the applicable waste-management rules. A shipment leaving a country is not, by itself, proof of useful recycled output.
How to read any plastic recycling statistic
- Check the geography: a city, the UK, the EU and the whole world are different populations.
- Check the denominator: all plastic waste, packaging, bottles, production and collected material answer different questions.
- Check the stage: collection, sorting, reprocessing and incorporation into new products are different points in the chain.
- Check the date: a 2026 publication may report 2024 data; a current webpage may still contain a 2018 series.
- Check the status: administrative records, industry surveys, provisional estimates and model projections have different limitations.
Our World in Data's plastics background is a useful companion for understanding production, use and waste. Use the dated primary releases linked above when quoting the rates in this article.
Common questions
Is only 9% of plastic recycled?
That familiar shorthand needs a source and year. The OECD's newer model baseline is 9.5% of global plastic waste in 2020. A similar-looking percentage of new production made from recycled resin answers a different question.
Does the UK recycle more than half of all its plastic?
The provisional 57.3% figure is for plastic packaging in 2025. It does not establish a UK recycling rate for all plastic products.
Is the US recycling rate still 8.7%?
That is the EPA's 2018 result, the latest year in its published plastics-in-municipal-waste table checked here. It should not be described as a measured current-year rate.
Does recycled plastic always become another bottle?
No. Recovered material may go into different products. Bottle-to-bottle recycling is one route, subject to collection quality and suitable processing. See the separate PET guide for preparation advice.
Conclusion: Is Plastic Production Still Out of Control?
My view is that plastic production is still out of control in the practical sense that we are creating a waste problem faster than we are bringing it under effective management. Plastic has valuable uses, but continuing to expand avoidable, short-lived products while relying on future recycling and clean-up is not a convincing solution.
Even the industry's own Plastics Europe preliminary estimates show global production growing from 413.8 million tonnes in 2023 to 430.9 million tonnes in 2024. These figures have a defined industry scope, excluding some applications such as most textile fibres; they should not be spliced into broader production series elsewhere in this article.
What are governments and industry saying?
The disagreement is about how far upstream action should go. In its 2024 ministerial statement, the High Ambition Coalition called for production and consumption of primary plastic polymers to be reduced to sustainable levels, alongside product-design rules and better waste management.
The World Plastics Council's July 2025 position instead emphasised collection infrastructure, circularity, recycled-content demand and national measures adapted to local circumstances. These are attributed policy positions, not evidence that either approach has already solved the problem. My judgement is that better collection and recycling are essential, but they should accompany action to reduce unnecessary production and expand reuse.
Is ocean cleanup actually reducing the problem?
Yes, cleanup removes waste from the places where it operates and river interception can stop some waste reaching the sea. That does not establish that the total amount of plastic in the world's oceans is falling.
As checked on 7 November 2026, The Ocean Cleanup's own website reported more than 65 million kilograms of trash removed cumulatively. That is a self-reported combined programme total, not an annual figure for plastic extracted from the open ocean. Its activities include river interception and other cleanup work. Its separate 2025 review reported over 25 million kilograms of trash removed from aquatic environments that year.
Other organisations also make a measurable contribution. Ocean Conservancy's August 2026 release reported that its 2025 International Coastal Cleanup volunteers collected more than 1.3 million plastic bottles and 885,000 caps from beaches and waterways. but, before you think that's a significant amount remember that these counts only demonstrate that some removal is taking place, not a worldwide trend in ocean plastic.
There are limits. Floating-debris systems cannot recover every fragment distributed through the water column, seabed and shorelines. The Ocean Cleanup acknowledges that it cannot remove every piece; its target concerns floating ocean plastic. Removing larger objects can also prevent some future fragmentation, but it cannot retrieve all the microplastics already dispersed.
To demonstrate a net global improvement, we need evidence that new inputs and fragmentation are being brought under control, alongside long-term monitoring of what remains. Cleanup totals alone cannot answer that question, and tonnes of mixed river trash should not be directly compared with estimates of plastic entering the ocean.
I support plastics cleanup, but I would not use its limited current success as permission to keep increasing avoidable plastic production. We need to remove existing pollution, stop new leakage, build reliable collection systems and reduce unnecessary plastic use together.
[Published March 2020. Updated November 2026.]



Nice post and good information on how much plastic is recycled. Thanks for sharing.
Really a good information !
I truly adored perusing your blog. It was very much written and straightforward.